
|
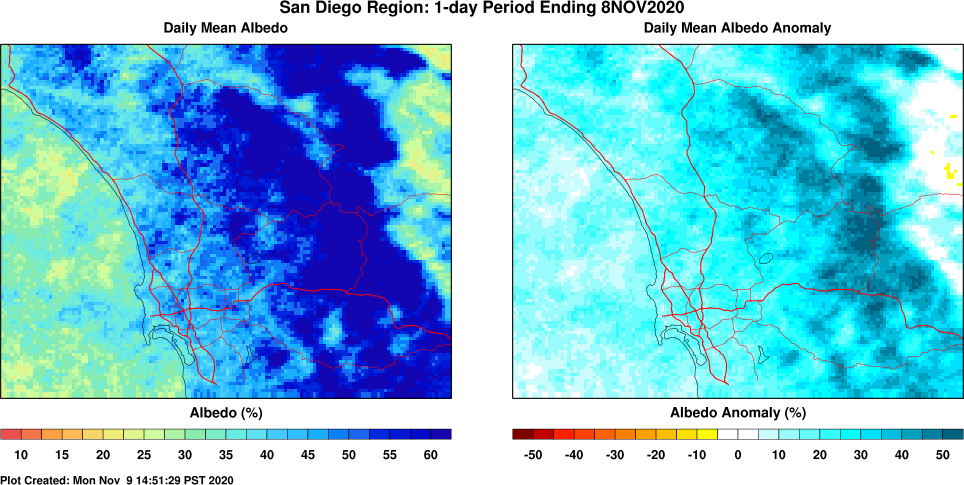
The figure below shows the albedo (left panel) and albedo anomaly (right panel) as measured by
NOAA GOES retrievals. Albedo is defined as the amount (here in units of percent) of incoming solar
radiation reflected back to space. Clouds play the dominant role in the reflection of solar radiation
and for this reason albedo is a convienent proxy for cloud cover (e.g., more than normal cloud
cover will result in larger than normal values of albedo).
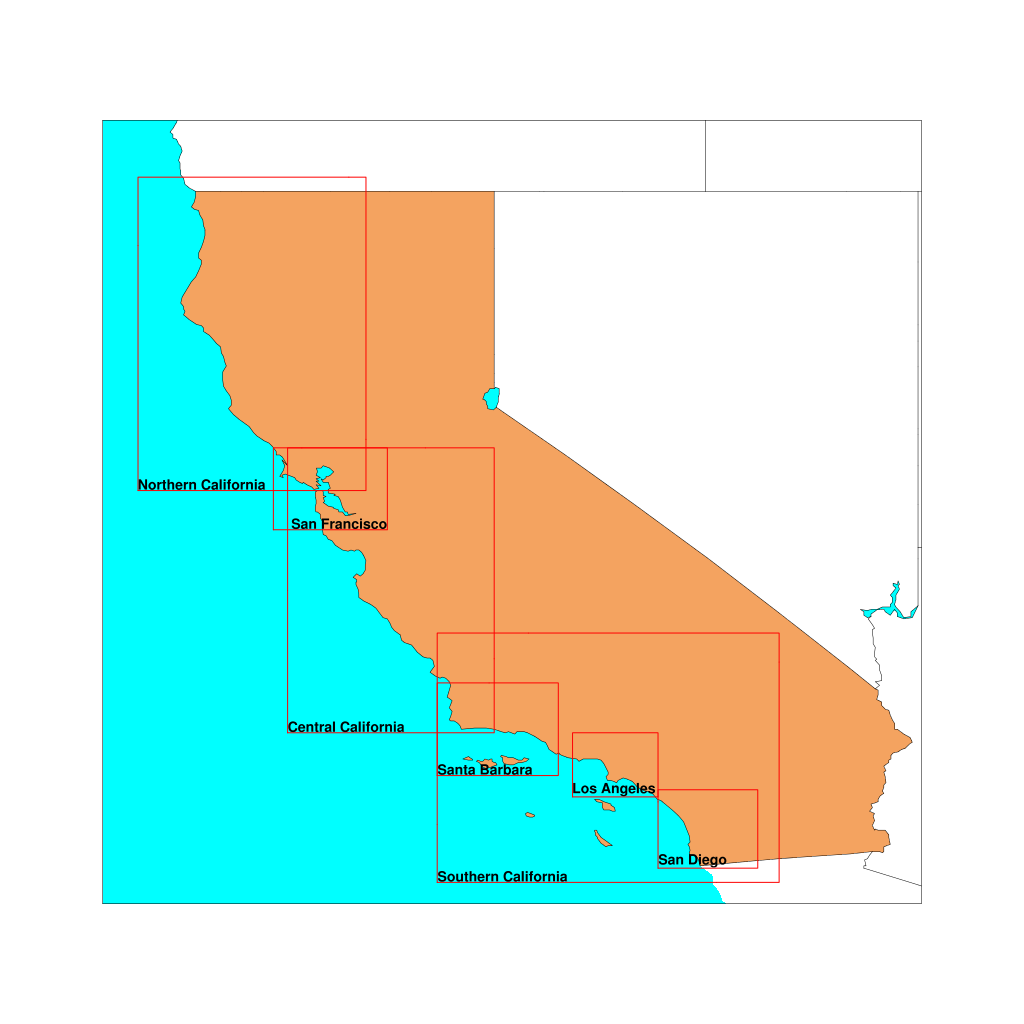
Maps are produced showing albedo and albedo anomaly averaged over the most recent 1, 5, 10, and 30-day periods for the regions shown in the adjacent figure. The red lines in the figures are major highways in the region. By default, this page will load the most recent 1-day period for the San Diego region. Under most circumstances the multi-day periods will be up to and including yesterday. Click on the links below for to view figures for different time periods and/or regions.
|
|
|
Click here for maps of monthly mean albedo over California/Nevada
from 1996 to present.
|
| San Diego region | 1-day | 5-day | 10-day | 30-day |
| Los Angeles region | 1-day | 5-day | 10-day | 30-day |
| Santa Barbara region | 1-day | 5-day | 10-day | 30-day |
| San Francisco region | 1-day | 5-day | 10-day | 30-day |
| Southern California | 1-day | 5-day | 10-day | 30-day |
| Central California | 1-day | 5-day | 10-day | 30-day |
| Northern California | 1-day | 5-day | 10-day | 30-day |
|
Questions and Comments:
Sam Iacobellis
Division of Climate, Atmospheric Sciences, and Physical Oceanography
Scripps Institution of Oceanography
La Jolla, CA 92093
sam@ucsd.edu