|
|
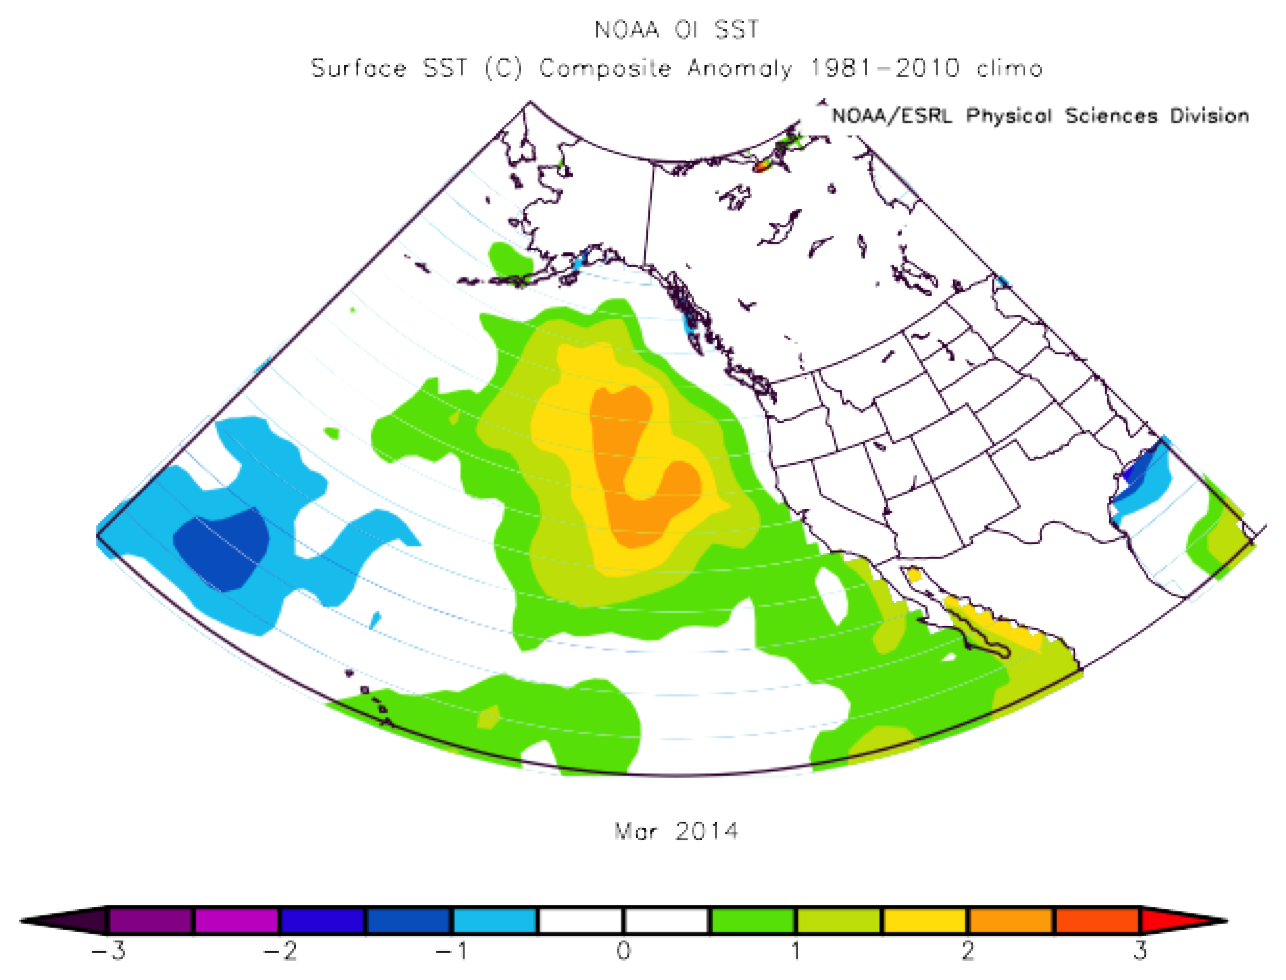
Of course, nobody can predict this exactly, but there are some indicators such as sea surface temperature (SST) that can give us some hints. Generally, cooler than normal SST off of the Southern California coast is associated with higher than normal amounts of marine layer clouds in San Diego and most of Southern California.
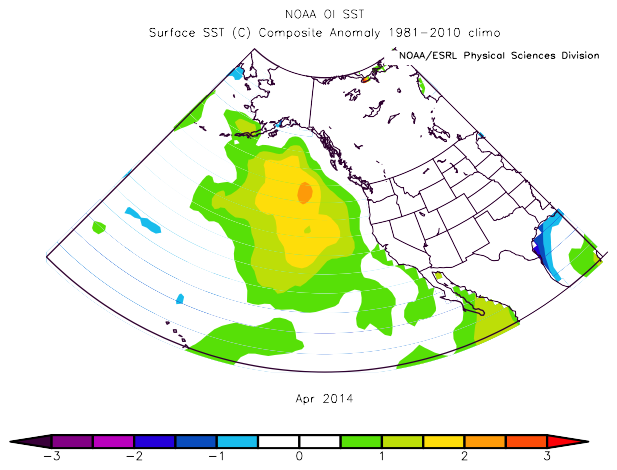
The water temperatures off the Western U.S. coast was a little warmer than normal in March and April 2014 as shown in the figures below. This is considerably different than the past few years which saw cooler than normal SST off most of the West Coast.
Colder sea surface temperatures will generally increase the strength of the inversion layer making it more likely that marine layer clouds will form. Additionally, cooler SSTs generally increase the coast-inland temperature contrast during the day which enhances the strength of the sea-breeze circulation. Near the surface, the sea-breeze is an onshore flow and can help transport marine layer clouds over the Southern California coastal land regions. However, too strong of a sea breeze can act to disrupt the temperature inversion which can lead to a decrease in marine layer clouds.
Closer to home here in San Diego, the SST at Scripps Pier was near normal for much of April, although there were a few days where it dropped below normal. These dips may be related to local wind events which mixed the surface water with cooler deep water from below. SST at any given coastal location usually exhibits some short term variability, which is evident in the "wiggles" in the red curve.
The table below shows the percentage of time that low clouds were present during daylight (8am-4pm PDT) hours at San Diego Lindbergh Field for the months May through September. Included in the table are values for the present year and climatological (based on 1960-2009 period) values. Values from 2009-2013 are also shown for comparison.
Values for 2014 will be updated as data becomes available.
| MONTH | CLIMATOLOGY | 2009 | 2010 | 2011 | 2012 | 2013 | 2014 |
|---|---|---|---|---|---|---|---|
| MAY | 32% | 45% | 18% | 25% | 29% | 21% | 16% |
| JUN | 37% | 26% | 47% | 39% | 44% | 36% | 26% |
| JUL | 29% | 19% | 58% | 24% | 29% | 34% | 22% |
| AUG | 25% | 22% | 19% | 29% | 22% | 19% | 15% |
| SEP | 23% | 11% | 23% | 32% | 11% | 22% | 6% |
The plot below shows the daytime low cloud fraction (1.0=100%) at San Diego Lindbergh for each individual day.
Present Year (2014) Low Cloudiness at San Diego Lindbergh
Low Clouds Only (Cloud Base < 2500 ft)
Red Line = Long-term Climatology