The 2001 forecast results were poor (Table 1). Therefore, the rationale behind this annual effort is revisited and the forecast errors are analyzed to see what can be learned.
Table 1. Observed and Predicted Maximum Daily Snowmelt Discharge, 2001.
| River |
Maximum Daily Discharge
Observed ++ Predicted (Cubic Meters per Second) |
Difference
Observed minus Predicted (+ or -) |
Day of
Maximum Discharge |
Mean Day of
Maximum Discharge |
|
| Carson | 8.9 | 8.1 | + | 121 | 130 |
| Gunnison | 56 | 99 | - | 137 | 158 |
| Kern | 56 | 27 | + | 137 | 148 |
| Kings | 34 | 18 | + | 121 | 139 |
| Merced | 57 | 39 | + | 129 | 148 |
| San Joaquin \1 | - | 64 | - | - | 149 |
| Walker | 47 | 31 | + | 136 | 152 |
| Weber | 44 | 33 | + | 136 | 154 |
| Yellowstone | 131 | 156 | - | 136 | 161 |
Background
The forecast is based on a strong linear correlation between initial snowpack depth and the daily maximum discharge attained during annual snowmelt. Initial snowpack is snow depth or snow water equivalent observed on or near April 1. It is logical that the maximum daily snowmelt discharge (MDSD) is a function of initial snowpack depth. However, it is not necessarily intuitive that the correlation is approximately linear (Fig. 1).
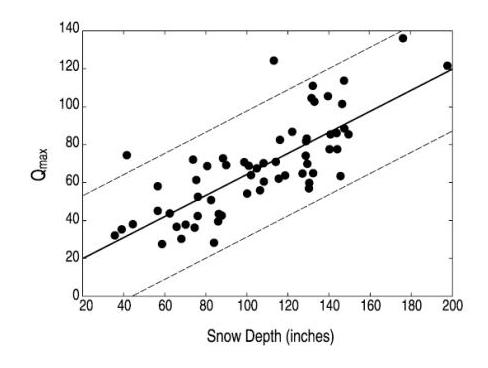 Figure 1. Maximum daily snowmelt
discharge from the Merced River
at Happy Isles vs. snow depth at Snow Flat.
Figure 1. Maximum daily snowmelt
discharge from the Merced River
at Happy Isles vs. snow depth at Snow Flat.
Interestingly, the timing or phase of MDSD is also dependent on the initial snowpack depth, although weakly (Fig. 2). In high elevation watersheds where winter precipitation is distinct from the spring snowmelt cycle, such as in the Sierra Nevada (Cayan, Riddle, and Aquado, 1993), the delay in timing of MDSD with increasing initial snowpack depth is caused by the increasing energy demand to melt a deeper than shallower initial snowpack (c.f. Cayan, et.al, 1999). In essence, initial snowpack size largely controls the amplitude of the MDSD (the strong correlation in Fig. 1) but much less so the MDSD timing or phase (the weak correlation in Fig. 2).
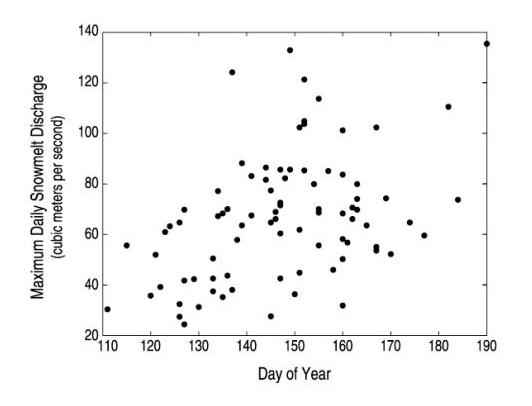 Figure 2. Maximum daily snowmelt discharge
vs. the day of maximum daily snowmelt discharge, Merced River
at Happy Isles.
Figure 2. Maximum daily snowmelt discharge
vs. the day of maximum daily snowmelt discharge, Merced River
at Happy Isles.
Forecasting the timing of MDSD is a much more difficult problem than
forecasting amplitude. The timing of the MDSD is probably a function of
the energy (air temperature and solar insolation) history as snowmelt
progresses. Because air temperature and solar insolation covary (Leavsley
et.al., 1983), air temperature history may serve as a proxy for energy
history (i.e., if you can forecast air temperature, you can forecast
energy). The MDSD magnitude is forecasted weeks or months in advance. This
time span is beyond the range of useful air temperature forecast skill
(approximately 5 to 10 days) making it difficult to estimate the energy (air
temperature) history leading to the timing of MDSD. This is a moot
point, however, because how energy history determines the timing of
MDSD is not known.
The 2001 Forecast
The skill in forecasting MDSD strongly depends on the how well "initial" snowpack depth is estimated. In this experimental forecast, only one location of snowpack observations is used to represent the watershed snowpack conditions above the river discharge gage. The snowpack discharge correlation in Fig. 1 accounts for 60% of the variance. If an index representing the entire watershed above the gage is used, such as the sum of daily discharge values over the snowmelt season, the correlation between the index and MDSD is stronger (80% of the variance) than between initial snowpack depth and MDSD. Obviously, this streamflow-based index is computed after the fact and, therefore, has no forecast skill, and also is subject to rain contamination. However, the improvements provided by knowing the "actual" amount of snowpack present (as indicated by the total snowmelt later on) suggests a regression with more than one snowpack location could improve the estimate of initial snowpack depth, increasing forecast skill (future research).
The above describes a spatial sampling error. This error, however, is not the cause of the large forecast error observed for 2001. The 2001 forecast error was probably of a temporal rather than spatial origin. The 2001 snowmelt season in the Sierra Nevada started before April 1, then stopped as new snowpack was added after April 1 and then snowmelt restarted (Fig. 3). The new snow after April 1 is probably why the forecasts underestimated MDSD, at least in the California rivers (note the positive differences in Table 1).
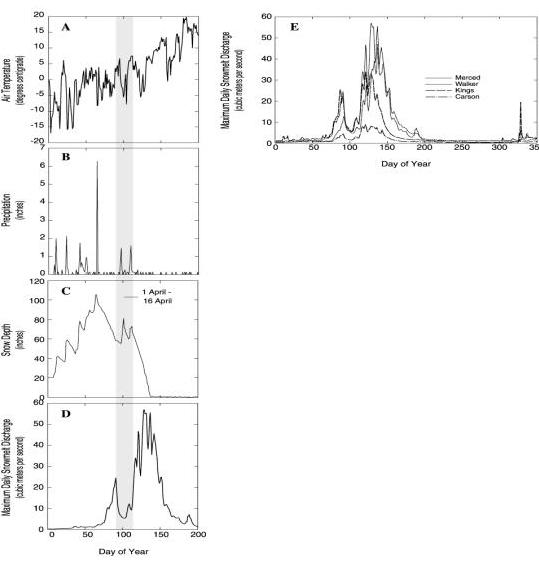 Figure 3. Air temperature (A), precipitation (B),
and snow depth (C) at Gin Flat in Yosemite National Park. Merced
River discharge (D) and Merced, Kings, Carson and Walker River
discharge (E).
Figure 3. Air temperature (A), precipitation (B),
and snow depth (C) at Gin Flat in Yosemite National Park. Merced
River discharge (D) and Merced, Kings, Carson and Walker River
discharge (E).
The regression equation used to estimate the magnitude of MDSD for the Merced River above Happy Isles gage is based on observations from Snow Flat and daily observations have been discontinued at this station. The observations at Gin Flat (Fig 3) provide a measure of the increase in snowpack after April 1, which is substantial. Note the decrease in air temperature (panel A), increase in precipitation (panel B), increase in snowpack (panel C), and decrease in discharge (panel D) are internally consistent and other Sierra Nevada Watersheds show the same discharge pattern as the Merced (panel E). If we had the same observations at Snow Flat that are made at Gin Flat this snow depth increase could be used in the regression equation to estimate a MDSD value to be added to the underestimate.
To illustrate this point, make the crude approximation that if 20 inches of new snow fell on Gin Flat after the start date (Fig 3c), then something like this may have fallen at the other sites as well. To test the effect of this added water quantitatively, the regression equations from earlier forecasts for the California site were used. If 20 more inches is added to the depths that goes into those equations, almost ALL of the error in the California rivers MDSD forecasts is eliminated (Table 1a), except on the Carson, the one good California forecast. The additional April snow input is not just the explanation that makes most sense, but is quantitatively a good fix. (Notice that the errors after this "correction" are both positive and negative, so the bias (except at Carson) is gone. Thus, spring 2001 is a clear example of the detrimental effect of late precipitation on these forecasts, an effect that was always expected to reduce skill in some years.
Table 1a. Forecasts, and what the forecasts would have looked like if
the April 1 snow depths in all the California basins had been increased by
the +20 inches seen at Gin Flat in early April 2001.
| River |
ACTUAL FORECAST
++ Maximum Daily Discharge Observed ++ Predicted (Cubic Meters per Second) |
"CORRECTED"
FORECAST |
FORECAST
ERRORS as % of observed ++ ACTUAL ++ CORR |
||
| Carson | 8.9 | 8.1 | 13 | -9 | +45 |
| Gunnison | 56 | 99 | -- | +77 | -- |
| Kern | 56 | 27 | 52 | -52 | -7 |
| Kings | 34 | 18 | 36 | -47 | +6 |
| Merced | 57 | 39 | 50 | -32 | -12 |
| San Joaquin \1 | - | 64 | - | - | - |
| Walker | 47 | 31 | 43 | -34 | -9 |
| Weber | 44 | 33 | -- | -25 | -- |
| Yellowstone | 131 | 156 | -- | +19 | -- |
In the Rocky Mountain region, however, the pre- and post- April 1 snowmelt and snow addition phenomena were not observed (Fig 4). This region also differed from the Sierra Nevada watersheds in that the forecasts were overestimated rather than underestimated (note the negative differences in Table 1).
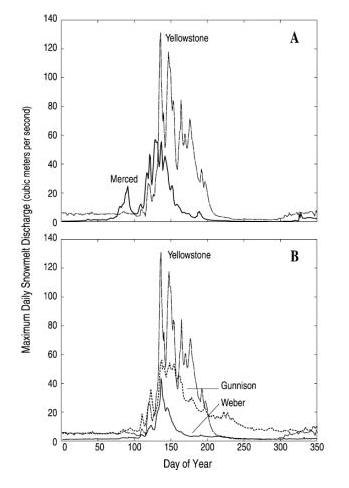 Figure 4. Merced and Yellowstone River discharge (A)
and Yellowstone, Gunnison and Weber River discharge (B).
Figure 4. Merced and Yellowstone River discharge (A)
and Yellowstone, Gunnison and Weber River discharge (B).
The reasons for the Rock Mountain region overestimates are not yet understood. The MDSD peaked much earlier in 2001 than the means for the period of record (Table 1), and the timing was very similar for most watersheds. The similarity in timing was in response to a large-scale atmospheric warming across much of western US in mid-May (Fig 5). The Merced, Kings and Carson Rivers responded to earlier May warming patterns that were confined to the southwestern U. S. (Fig 6). The Kern MDSD timing, however, was the same as in the Rocky Mountain watersheds (Table 1).
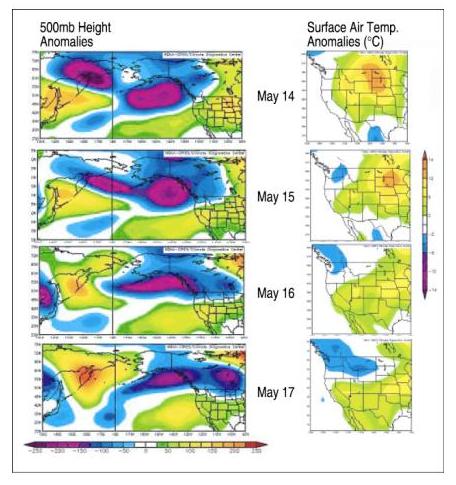 Figure 5. The 500mb atmospheric pressure (in meters) and
surface air temperature (in centigrade) anomalies for the year 2001.
Figure 5. The 500mb atmospheric pressure (in meters) and
surface air temperature (in centigrade) anomalies for the year 2001.
Because of the regional difference in daily snowmelt discharge patterns (Figs 3 and 4), it is not surprising the more distant Weber, Yellowstone and Gunnison interbasin daily discharge correlations are weak when compared to the Sierra Nevada basins (Table 2).
Table 2. Inter basin daily discharge correlation matrix for 2001
\1
| Merced | Kings | Carson | Walker | Weber | Yellowstone | Gunnison | |
| Merced | 1.00 | 0.89 | 0.96 | 0.96 | 0.84 | 0.59 | 0.63 |
| Kings | ++ | 1.00 | 0.95 | 0.76 | 0.57 | 0.29 | 0.34 |
| Carson | ++ | ++ | 1.00 | 0.88 | 0.72 | 0.45 | 0.50 |
| Walker | ++ | ++ | ++ | 1.00 | 0.92 | 0.75 | 0.78 |
| Weber | ++ | ++ | ++ | ++ | 1.00 | 0.79 | 0.80 |
| Yellowstone | ++ | ++ | ++ | ++ | ++ | 1.00 | 0.91 |
| Gunnison | ++ | ++ | ++ | ++ | ++ | ++ | 1.00 |
The correlation coefficients in Table 2 were estimated for January 1 to December 16 observations. Data beyond December 16 was not available for the Gunnison River. If the correlations were confined to the shortest snowmelt discharge season, such as observed for the Kings or Carson Rivers, the correlations would be stronger. For example, the correlation between the Kings and Carson River (R=0.95) is stronger than between the Kings and Merced River (R=0.89) even though the Kings River watershed is closer to the Merced watershed than the Carson watershed. The reason for this stronger correlation over a greater distance is because the Kings and Carson watersheds had a shorter snowmelt season in 2001 compared to the Merced watershed.
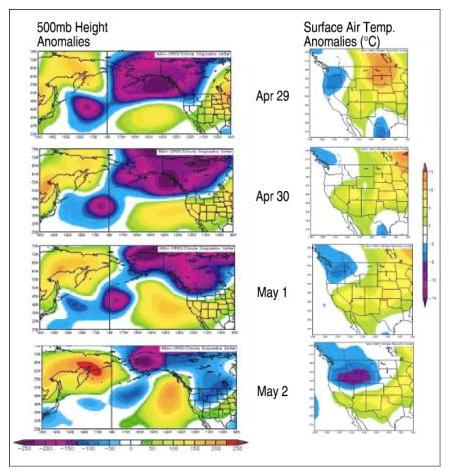 Figure 6a. The 500mb atmospheric pressure (in meters) and
surface air temperature (in centigrade) anomalies for the year 2001.
Figure 6a. The 500mb atmospheric pressure (in meters) and
surface air temperature (in centigrade) anomalies for the year 2001.
Figure 6b. The 500mb atmospheric pressure (in meters) and
surface air temperature (in centigrade) anomalies for the year 2001.
The linear relation between MDSD and initial snow depth should be a useful characteristic in building and testing physical-based models of the relevant snowmelt processes. Physically-based models are essential in attempting to fill data gaps, and in providing insight into the nature and causes of temporal and spatial variations, including future scenarios.
The simple approach used here is satisfying largely because of the
remarkable coherence in fine-scale snowmelt discharge variations,
spanning multi-basins. A major concern, however, is the continued loss of
already sparse snowmelt discharge gages, such as in the upper San Joaquin
and Stanislaus watersheds
References
Cayan, D.R., Peterson, D.H., Riddle, L., Dettinger, M.D., and Smith, 2000. The spring runoff pulse from the Sierra Nevada. Preprints, American Meteorological Society's 14th Conference of Hydrology, Dallas, January 1999, 77-79.
Cayan, D.R., L.G. Riddle and E. Aguado, 1993. The Influence of Precipitation and Temperature on Seasonal Streamflow in California. Water Resources Research 29(4):1127-1140.
Leavesley, G.H., R.W. Lichty, B.M. Troutman and L.G. Saindon, 1983. Precipitation - Runoff Modeling System - Users Manual. U.S. Geological Survey, Water Resources Investigation Report 83-4238, 207pp.