California Nevada Climate Applications Program (CNAP)

Climate information for California and Nevada decision makers
Funded by the NOAA Climate Program Office
CNAP is a NOAA/CPO Regional Integrated Sciences and Assessments (RISA) member

CNAP and KPBS Drought Tracker Update
Read the latest on the CNAP BLOG

(updated 11 March 2016)

Follow CNAP:
Twitter
E-mail

References
Contacts/Personnel
Upcoming Conferences
Past Conferences
CNAP DOCS
CNAP Collaborating sites Western Regional Climate Center
Southwest Climate Science Center
Climate Assessment for the Southwest
Center for Western Weather and Water Extremes (CW3E)
Center for Climate Change Impacts and Adaptation
Climate Impacts Research Consortium
Western Water Assessment

Monitoring El Niño impacts
January-March percent of normal precipitation during El Niño and positive phase of the Pacfic Decadal Oscillation (composite of 7 events)

As we view the current El Niño from late summer through fall 2015, it is on par with the very large El Niño events of 1982-83 and 1997-98. Above normal precipitation may follow the pattern that occurred in strong El Niño years. The Pacific Decadal Oscillation (PDO) is another climate pattern that can reinforce the El Niño precipitation impact in California and Nevada. The PDO is currently in its positive phase, thus the El Niño/+PDO compostie shown to the left may serve as an analog for the current winter.

(Click here for CNAP publication "El Niño in California and Nevada")

  • Daily Sea Level Anomalies
    Past strong El Niño events are associated with extensive coastal damage during storms. When storms coincide with high sea levels the damage can be amplified. Please visit our daily sea level anomalies page to see predicted and observed sea level heights at key locations along the California coast.
  • Precipitation: San Diego, California and the 8-Station Index
    Precipitation is a primary component of El Niño events for San Diego and other regions of the west. This page provides daily updates on the water year-to-date accumulation for San Diego county, California and a collection of stations known as the "8-Station Index". The information on this page allows you to quickly see how current conditions relate to other years and other strong El Niño years. For example, On November 25, 2015, San Diego County was at 8.6% of the water year total which is slightly below the mean of 11.7% for this day. All of California is at 10.8%; lower than the mean of 15.8%. The 8-Station Index is at 9.4%; lower than the mean of 16.8%. For a graphic showing the location of the 8-Stations please click here.
  • Daily Regional Snow Update
    Snow accumulation is critical to California's water supply. The image below (click to view larger image) shows the percent of April 1st snow water equivalent for 4 regions: Northern Sierra, Central Sierra, Southern Sierra and Upper Colorado River Basin. Recent dry winters (2013-14 and 2014-15), a wet winter (1997-98) and the current winter (2015-16) are shown. More details and data files can be found here.

El Niño and its impact on California and Nevada
(Please click above for the CNAP El Niño web page)

Please click below for presentations from recent California NIDIS Winter Status Update -
22 January 2016 and 26 January 2016
Precipitation Percentiles for California and Nevada climate divisions:
click here for graphics over the last 10 years or since 1900 as a function of timescale.
Follow southern California NIDIS information: E-mail

Drought continues over California and Nevada
Don't Count on El Niño to End the Drought
July 9, 2015: Public Policy Institute of California Blog Post by CNAP reseacher Dan Cayan and Jeffrey Mount
Please click here for the post
Quick links to the latest drought related information

Click here for PowerPoint presentation of images in above loop
Dought conditions continue to be extreme to exceptional over California and Nevada. The total precipitation over the last three years is at or below 70% of normal over much of California with some areas reporting less than half the normal precipitation. 2015 temperatures in both states are amongst the warmest recorded (since 1895).
http://cnap.ucsd.edu/western_drought.html


The Great Basin Weather and Climate Dashboard
Great Basin Climate Forum Series: Past and Present


Our most popular
publications

Sierra Nevada Snowpack

El Niño in California and Nevada

California Heat Waves

Drought in Southern California

California Precipitation

California Climate
Change Indicators

Assessment of Climate Change
in the Southwest United States

Our Changing Climate 2012

Our Changing Climate 2006

California Climate Extremes Workshop

San Diego, 2050 is Calling (2015)

San Diego's Changing Climate (2010)
CNAP Research Climate and Wildfire in the western United States Southern California Marine Layer Clouds
Climate Science and the CALFED Bay-Delta Program ARkStorm: Extreme winter storm scenario for California


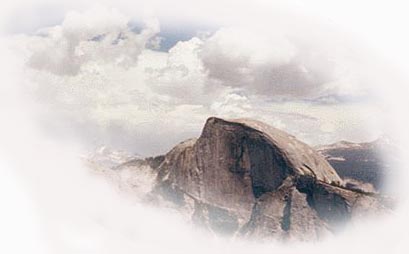
Recent webcam image of the Merced River at Happy Isles (USGS)
Happy Isles (Merced River) Webcam
USGS has opened a Happy Isles gage house in Yosemite Valley. CNAP researchers Mike Dettinger and Dan Cayan fought diligently for this new site. The site features a webcam showing the station and the merced River as it enters Yosemite Valley. The old gage house (circa 1915) can be seen in the background on daytime images.

For more information from this site including the latest gage readings and snaps/animations of recent days please click below:
http://ca.water.usgs.gov/webcams/happyisles/

Scripps Hydroclimate Weather Observations
San Diego Forecast
California/Nevada Current Radar
Western Infrared Image
Current southern California Santa Ana Conditions are indicated by the color of the button to the right
RED = YES Meteorological parameters indicate Santa Ana conditions are occurring
GREEN = NO Meteorological parameters indicate Santa Ana conditions are NOT occurring
Click here for more information
Western Regional Climate Center
IRI Forecasts
Climate Prediction Center
National Weather Service - San Diego
Data Resources
Reading Room

Recent articles of interest to climate and climate change
PACLIM 2015
PACLIM 2015 ran 8-11 March

MTNCLIM 2014
MTNCLIM 2014 ran 15-18 September in Midway, Utah

Links
Forecast Resources

Thank you for visiting the California Nevada Applications Program website!

CNAP is directed from the Climate Research Division, Scripps Institution of Oceanography
University of California - San Diego, 9500 Gilman Drive, La Jolla, CA 92093-0224
Phone: (858) 534-4507; FAX: (858) 822-2028

Last update: 11 March 2016
Please direct any comments or questions to:
CNAP

This website was prepared by CNAP partially under award NA17RJ1231 from the National Oceanic and Atmospheric Administration, U.S. Department of Commerce. The statements, findings, conclusions, and recommendations are those of the authors and do not necessarily reflect the views of the National Oceanic and Atmospheric Administration or the Department of Commerce.